The Problem
The Impaired Driving emphasis area includes those crashes where at least one driver was identified as having been drinking, having taken medication, been under the influence of alcohol or drugs, a blood alcohol content greater than zero, or a positive drug test.
Impaired driving types of crashes were the identified in 15,070 fatal and serious injury crashes (18% of all fatal and serious injury crashes) as well as 6,675 fatalities (34% of all fatalities) and 12,792 serious injuries (16% of all serious injuries) from 2017–2021.
34%
of fatalities were associated with a crash involving an impaired driver
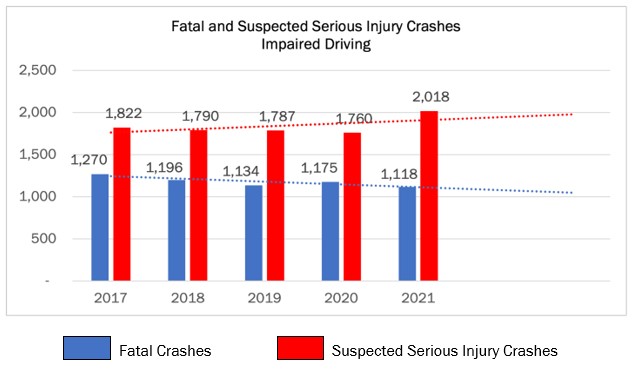
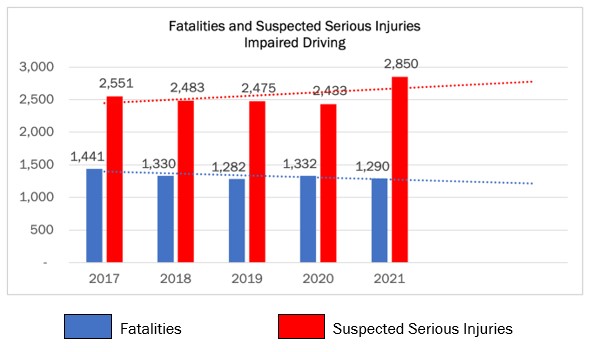
Impaired Driving: Crashes, Fatalities, and Suspected Serious Injury Crashes (2017-2021)

Impaired Driving: Fatal and Suspected Serious Injury Crashes (2017-2021)

Impaired Driving: Fatal and Suspected Serious Injuries (2017-2021)
Impaired Fatalities and Serious Injuries
Intersections
24%
Arterials
48%
State Roads
65%
Urban
50%
Single Vehicle
63%
Speeding
26%
Fatal and Serious Injury Impaired Driving Crashes
50% of Impaired Driving Fatal and Serious Crashes are Rural
61% of Impaired Driving Fatal and Serious Crashes Occur Between 9 p.m. and 4 a.m.
Proportion of Impaired Drivers in Fatal and Serious Crashes Relative to the Proportion of the Population by Age and Gender
Click a strategy below to learn more about the countermeasures for that strategy.
