The Problem
The fatal and suspected serious injury crashes related to pedestrians represents 11% and Padalcyclists represent 2% of all fatal and suspected injury crashes. Since 2017, pedestrian crash trend has increased, therefore it is important to reverse this trend to reach the state goal of zero deaths in 2050.
In the case of pedestrians, pedalcyclists and vulnerable road users, we need to consider separating users in terms of time and/or space. These aspects address both infrastructure and behavior by looking to dedicated transportation space for users moving at different speeds and, subsequently, reduce adverse interactions between users.
11%
ALL total fatalities and serious crashes
Combating the Issue
Strategies were developed to combat the Vulnerable Road Users problem.
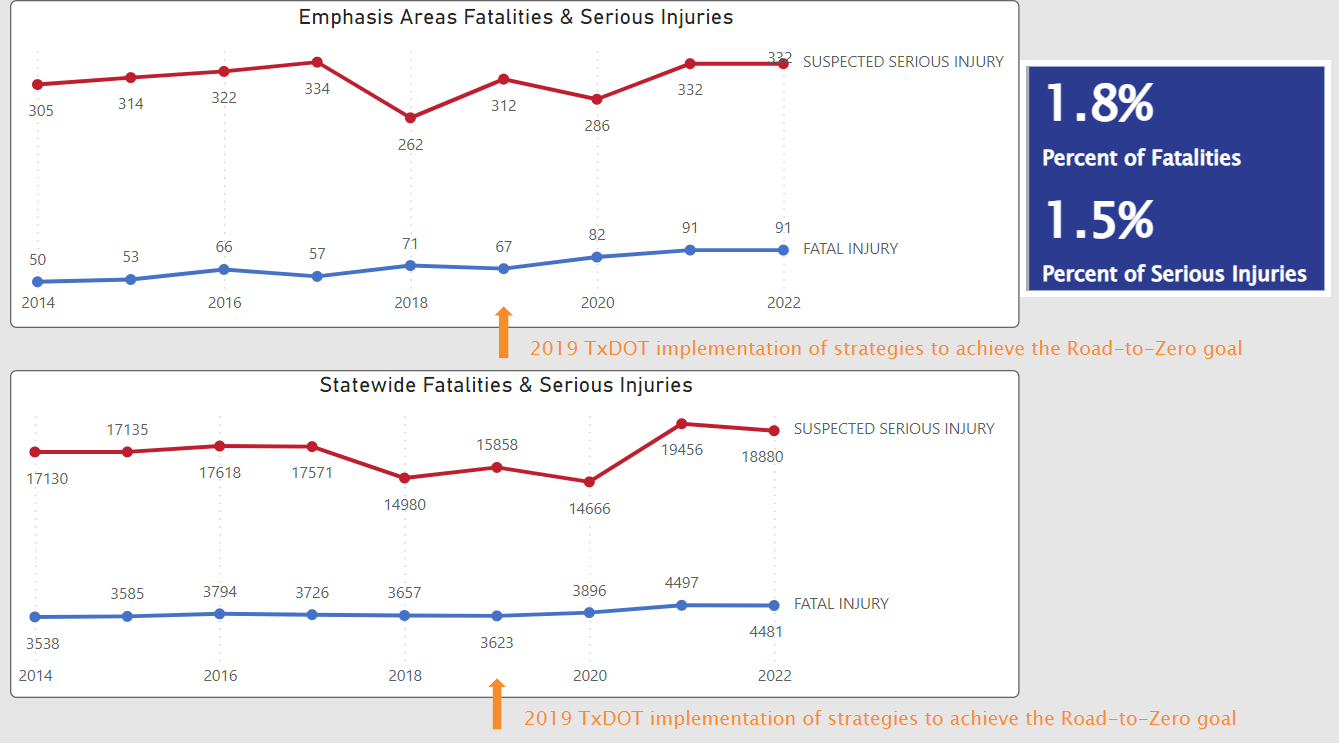
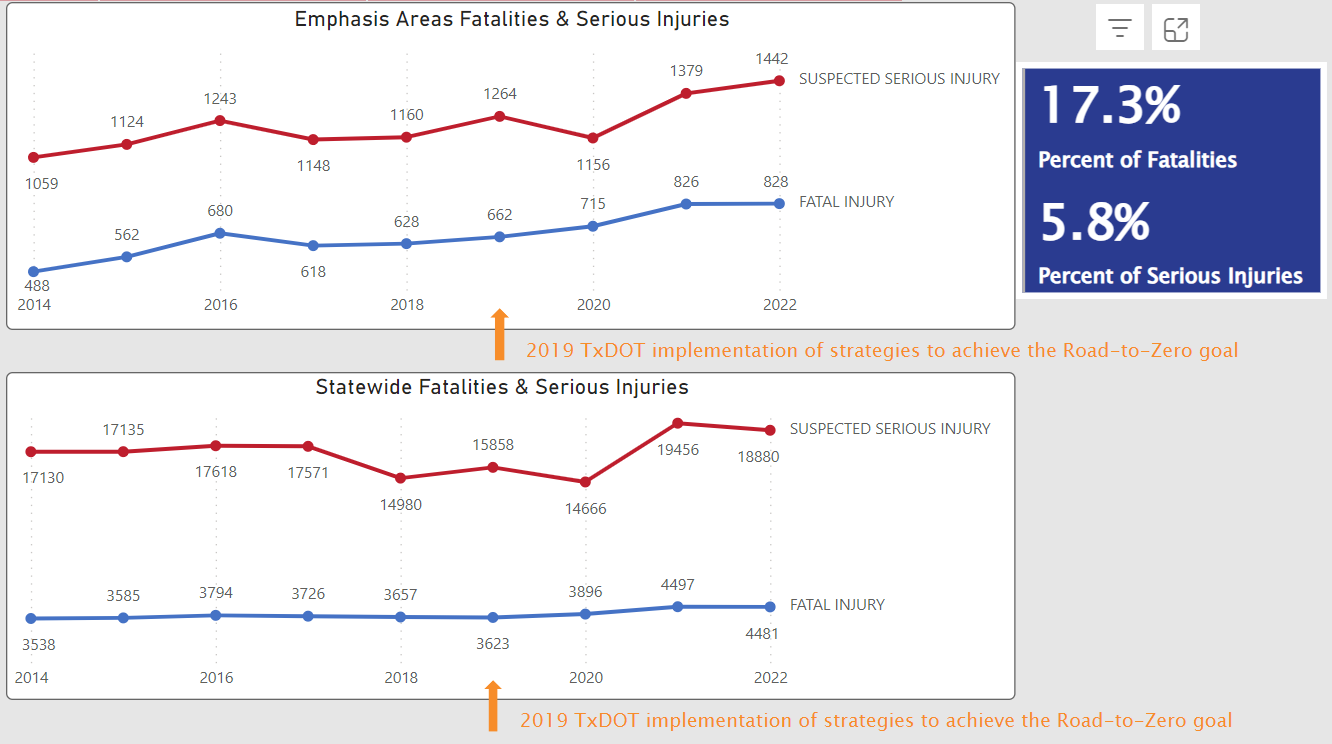
Strategies Programs and Projects Emphasis Area TeamVulnerable User Related Statewide Fatalities and Serious Injury Crashes (2014 - 2022)

Cyclist related fatalities and serious injuries compared to total statewide fatalities due to motor vehicle crashes from 2014 to 2022. SHSP was implemented between 2016 and 2017.

Pedestrian related fatalities and serious injuries compared to total statewide fatalities due to motor vehicle crashes from 2014 to 2022. SHSP was implemented between 2016 and 2017.
Vulnerable User Fatalities and Serious Injuries

41%
Pedestrian Crash - SUV or Pick-up Truck
77%
Pedestrian Crash - Dark Conditions in an Urban Setting
12%
Pedestrian Crash - Distracted Driver
61%
Pedalcyclist Crash - On-system
Fatal and Serious Injury Vulnerable Pedestrian Driving Crashes
Pedestrian and Pedalcyclist Crash - Urban
78%
Pedestrian Crash - Not Intersection
75%
Pedalcyclist Crash - Dark Conditions
53%
Click a strategy below to learn more about the countermeasures for that strategy.

