The Problem
The Speeding emphasis area includes those crashes where unsafe speed under the limit or speeding over the limit was cited as a contributing factor.
These types of crashes were the identified in 27,555 fatal and serious injury crashes (32% of all fatal and serious injury crashes) as well as 6,760 fatalities (35% of all fatalities) and 21,530 serious injuries (26% of all serious injuries) from 2017–2021.
35%
of fatalities were speed related
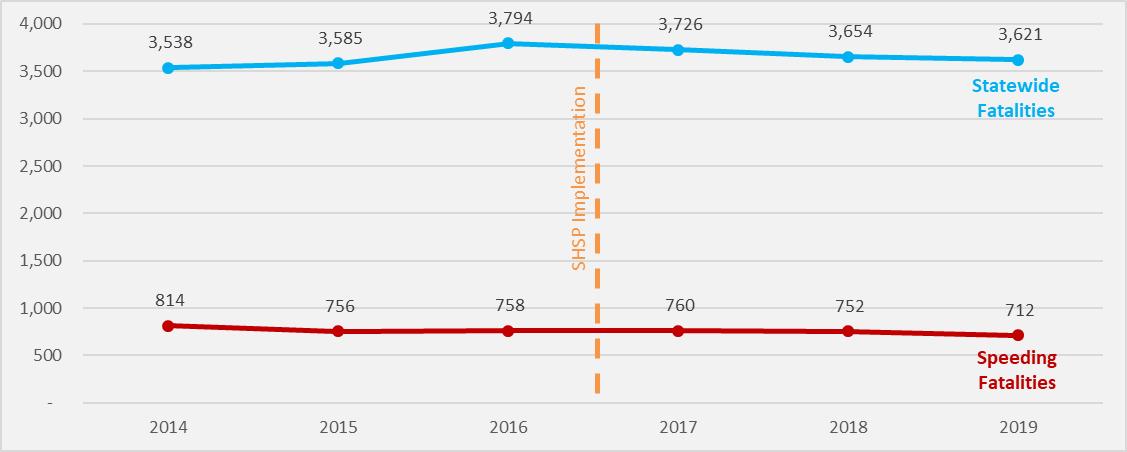
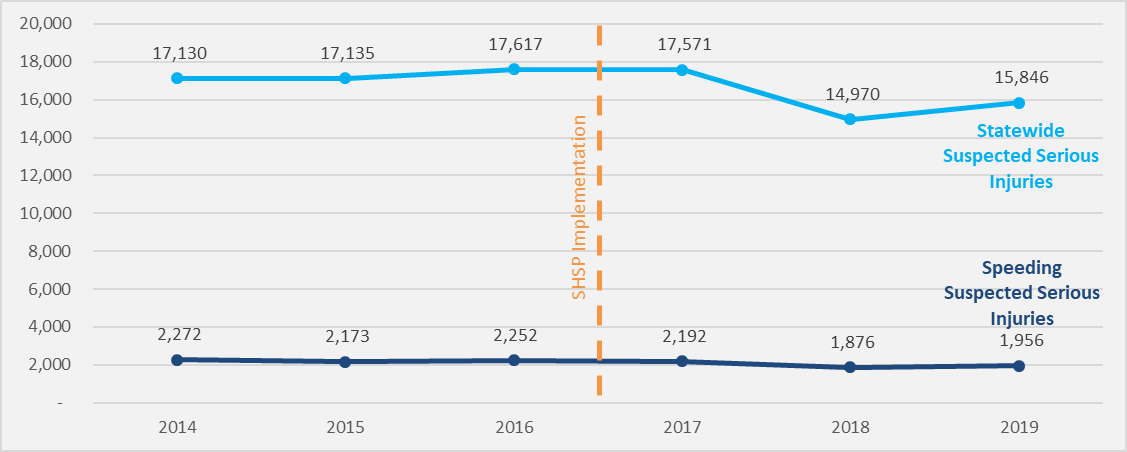
Speeding Fatalities and Serious Injuries (2014-2019)

Speeding related fatalities compared to total statewide fatalities due to motor vehicle crashes from 2014 to 2019. SHSP was implemented between 2016 and 2017.

Speeding related suspected serious injures compared to total statewide suspected serious injuries due to motor vehicle crashes from 2014 to 2019. SHSP was implemented between 2016 and 2017.
During the last five years (2017-2021), there were 27,560 fatal and serious injury crashes that were speed related.
Single Vehicle
50%
Impairment (fatalities)
43%
No Safety Belt (fatalities)
41%
Wet Conditions (fatalities)
17%
Distracted
11%
Fatal and Serious Injury Crashes
Fatal and Serious Injury Unsafe Speed Crashes (unsafe speed is under the speed limit)
Fatal and Serious Injury Over Speed Limit Crashes
Urban
Rural
Fatal and Serious Speeding Crashes by System and Area
Proportion of Drivers in Fatal and Serious Crashes Involving Speeding to the Proportion of the Population by Age and Gender
Click a strategy below to learn more about the countermeasures for that strategy.
